
.avif)

Table of Contents
Share with network
Related Insights
A global e-commerce company was bleeding money without realizing it. Their supply chain expenses were scattered across multiple suppliers, product categories, and sourcing channels, making it nearly impossible to pinpoint cost-saving opportunities.
Without a structured approach to spend analysis, cost containment efforts felt like a guessing game. The organization lacked visibility into:
Traditional reporting methods failed to connect the dots. The business needed a scalable, data-driven solution to reveal hidden savings and reduce their supply chain costs. That’s when executive management turned to Elliott Davis for help.
Enter Power BI, a game-changing business intelligence tool that transformed raw data into actionable insights. The Elliott Davis team deployed a 3-phase, 12-week approach to spend analysis and cost containment:
Using Power BI, the Elliott Davis team conducted a deep dive spend analysis across:
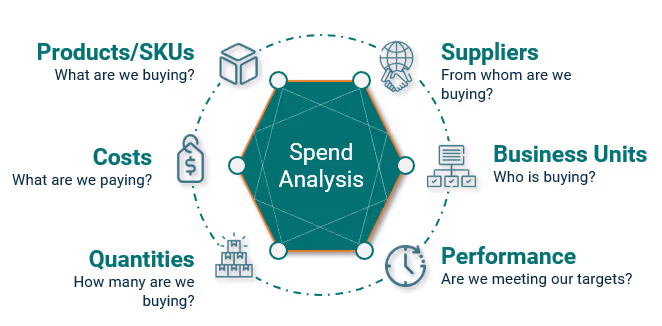
The data was visualized in customized Power BI dashboards, revealing inefficiencies and pinpointing areas for cost reduction.
A Pareto Analysis, otherwise known as the 80/20 rule, (80% of outcomes originate from 20% of causes) uncovered critical cost drivers:
This analysis redirected procurement efforts toward the highest-value opportunities.
The Elliott Davis team designed targeted cost containment strategies, including:
By the end of the engagement, the client has $1.2 million in identified cost-saving opportunities with a roadmap for continuous improvement.
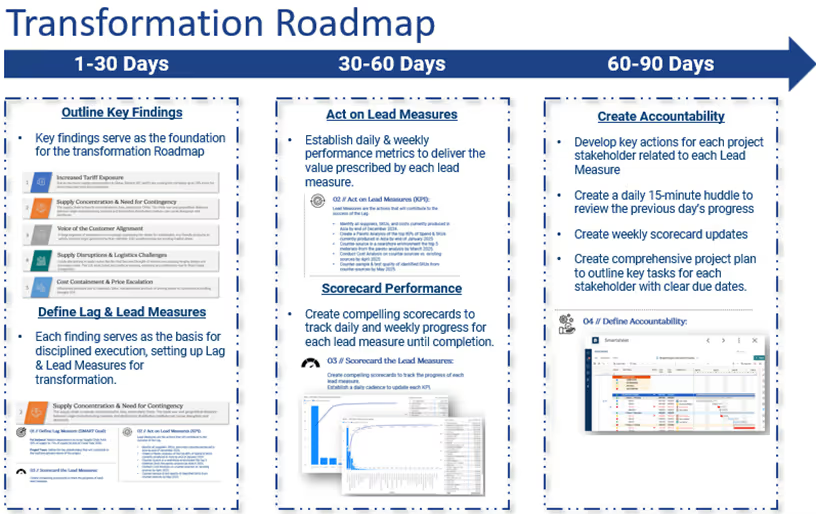
With this data-driven, repeatable framework, the company gained long-term control over spend assessment and cost containment, turning insights into sustained savings.
The information provided in this communication is of a general nature and should not be considered professional advice. You should not act upon the information provided without obtaining specific professional advice. The information above is subject to change.
the
authors
related
insights







.jpg)